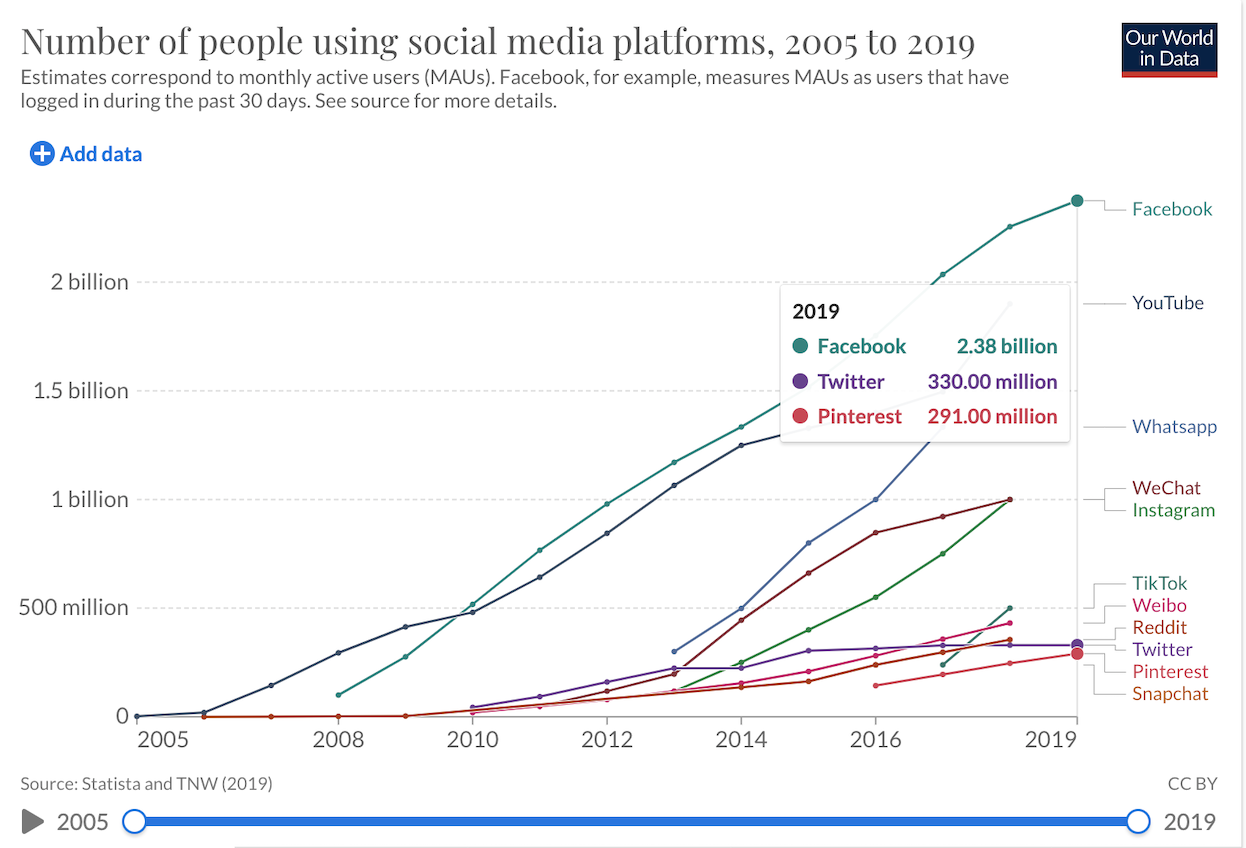
I downloaded the Loneliness and Social Connections data from Our World in Data. I selected this data because I am interested in the most popular social media platforms from 2005 to 2019.
This is the link to the data that I chose.
The following code chunk loads the packages that I will use to read in and prepare the data for analysis.
- Read in the data
- Use
glimpseto see the names and types of the columns.
glimpse(users_by_social_media_platform)
Rows: 142
Columns: 4
$ Entity                                           <chr> "Facebook",…
$ Code                                             <lgl> NA, NA, NA,…
$ Year                                             <dbl> 2008, 2009,…
$ `Monthly active users (Statista and TNW (2019))` <dbl> 100000000, …
# View(users_by_social_media_platform)
- Use output from glimpse (and View) to prepare the data for analysis
Create the object
media platformthat is the list of social media platforms I want to extract from the dataset.Change the name of 1st column to Media Platform and the 4th column to Active Users
Use filter to extract the rows that I want to keep: Year >= 2005 and Media Platforms in media_platforms
Select the columns to keep: media platforms, Year, active users
Use mutate to convert active users to billions of users
Assign the output to media_activity
Display the first 10 rows of media_activity
media_platforms  <- c("Facebook","Youtube","Whatsapp","WeChat","Instagram","TikTok","Weibo","Reddit","Twitter","Pinterest","Snapchat" )

media_activity  <- users_by_social_media_platform  %>%
  rename(media_platforms = 1, active_users = 4)  %>%
  filter(Year >= 2005, media_platforms %in%  media_platforms)  %>%
  select(media_platforms, Year, active_users)  %>%
  mutate(active_users = active_users * 1e-9)

media_activity
# A tibble: 136 × 3
   media_platforms  Year active_users
   <chr>           <dbl>        <dbl>
 1 Facebook         2008        0.1
 2 Facebook         2009        0.276
 3 Facebook         2010        0.518
 4 Facebook         2011        0.766
 5 Facebook         2012        0.980
 6 Facebook         2013        1.17
 7 Facebook         2014        1.33
 8 Facebook         2015        1.52
 9 Facebook         2016        1.75
10 Facebook         2017        2.04
# … with 126 more rows
Check that the total for 2019 equals the total in the graph.
# A tibble: 1 × 1
  total_active_users
               <dbl>
1               3.00
Add a picture of my dataset
Write the data to file in the project directory
write_csv(media_activity, file="media_activity.csv")